Performance Indicators
The performance indicators are used to review information about the current number of leads generated and vehicles sold as a result of XtreamService leads.

|
The performance indicators display on the Home screen. To access the Home screen, click the |
To expand the performance indicators and view additional information, click the ![]() (Expand) icon. Once the performance indicators are expanded, the Sold Matches Gross performance indicator and the Trade-Ins gross performance indicator display, where gross profit information can be viewed for sold matches as well as trade-ins.
(Expand) icon. Once the performance indicators are expanded, the Sold Matches Gross performance indicator and the Trade-Ins gross performance indicator display, where gross profit information can be viewed for sold matches as well as trade-ins.
To collapse the performance indicators, click the ![]() (Collapse) icon.
(Collapse) icon.
The Service Hot Leads performance indicator is used to review the number of leads generated for service appointments and walk-ins for the current day. This performance indicator can be viewed in either the Collapsed view or the Expanded view.
The Collapsed view of the Service Hot Leads performance indicator can be used to quickly view the number of leads generated for service appointments and walk-ins for the current day.
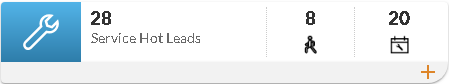
The following items display on the Service Hot Leads performance indicator in the Collapsed view.
Service Hot Leads: (Link) The total number of service hot leads generated for the current day displays as a link. Click this link to access the Service Hot Leads Details panel, where information, such as appointment times and customer names, for service hot leads can be reviewed.
![]() (Walk-Ins): (Link) The number of hot leads generated for service customers without appointments for the current day displays as a link. Click this link to access the Service Hot Leads Details panel, where information, such as appointment times and customer names, for service hot leads can be reviewed.
(Walk-Ins): (Link) The number of hot leads generated for service customers without appointments for the current day displays as a link. Click this link to access the Service Hot Leads Details panel, where information, such as appointment times and customer names, for service hot leads can be reviewed.
![]() (Appointments): (Link) The number of hot leads generated for service customers with appointments scheduled for the current day displays as a link. Click this link to access the Service Hot Leads Details panel, where information, such as appointment times and customer names, for service hot leads can be reviewed.
(Appointments): (Link) The number of hot leads generated for service customers with appointments scheduled for the current day displays as a link. Click this link to access the Service Hot Leads Details panel, where information, such as appointment times and customer names, for service hot leads can be reviewed.
The Expanded view of the Service Hot Leads performance indicator can be used to view the number of leads generated for service appointments and walk-ins for various time frames, including the current month and the current year. To access the Expanded view, click the ![]() (Expand) icon.
(Expand) icon.
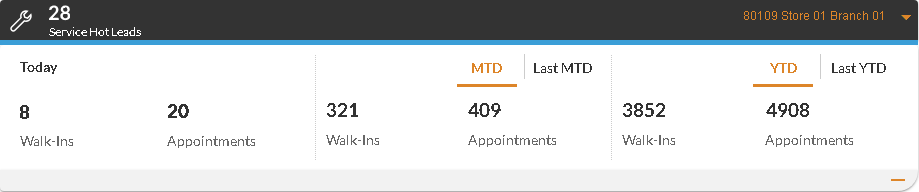
When the Service Hot Leads performance indicator is expanded, information displays for the current day, the current month-to-date (MTD), and the current year-to-date (YTD). To view information for the previous MTD select the Last MTD option. Alternatively, to view information for the previous YTD, select the Last YTD option.
The current MTD includes data from the first day of the month to the current date, and the previous MTD includes data from the same date range in the previous month. For example, when the performance indicator is reviewed on September 14, 2025, the current MTD includes data for September 1 to September 14, 2025, and the previous MTD includes data for August 1 to
The current YTD includes data from the first day of the year to the current date, and the previous YTD includes data from the same date range in the previous year. For example, when the performance indicator is reviewed on September 14, 2025, the current YTD includes data for January 1 to September 14, 2025, and the previous YTD includes data for January 1 to
The following items display on the Service Hot Leads performance indicator in the Expanded view.
Today - Walk-Ins: (Link) The number of hot leads generated for customers without appointments who visited the dealership on the current day displays as a link. Click this link to access the Service Hot Leads Details panel, where information, such as appointment times and customer names, for service hot leads can be reviewed.
Today - Appointments: (Link) The number of hot leads generated for customers with appointments scheduled for the current day displays as a link. Click this link to access the Service Hot Leads Details panel, where information, such as appointment times and customer names, for service hot leads can be reviewed.
MTD/Last MTD - Walk-Ins: The number of hot leads generated for customers without appointments who visited the dealership during the current or previous month-to-date (MTD) displays.
MTD/Last MTD - Appointments: The number of hot leads generated for customers with appointments scheduled for the current or previous MTD displays.
YTD/Last YTD - Walk-Ins: The number of hot leads generated for customers without appointments who have visited the dealership during the current or previous year-to-date (YTD) displays.
YTD/Last YTD - Appointments: The number of hot leads generated for customers with appointments scheduled for the current or previous YTD displays.
The Active Campaign performance indicator is used to review the number of prospects that have been contacted by Email message or by direct mail for the most recent sales campaign. This performance indicator can be viewed in either the Expanded view or the Collapsed view.
Note - The name of this performance indicator displays as the name of the most recent sales campaign.
The Collapsed view of the Active Campaign performance indicator is used to quickly view the number of prospects who have been contacted for the most recent campaign.

The following items display on the Active Campaign performance indicator in the Collapsed view.
Active Campaign: (Link) The total number of prospects who were included in the most recent campaign displays as a link. Click this link to access the Campaign Details panel, where information for the corresponding sales campaign, such as the number of vehicles sold as a result of the campaign, can be reviewed.
Note - The name of this field displays as the name of the most recent sales campaign.
![]() (Emailed): (Link) The number of prospects who were sent Email messages for the most recent campaign displays as a link. Click this link to access the Campaign Details panel, where information for the corresponding sales campaign, such as the number of vehicles sold as a result of the campaign, can be reviewed.
(Emailed): (Link) The number of prospects who were sent Email messages for the most recent campaign displays as a link. Click this link to access the Campaign Details panel, where information for the corresponding sales campaign, such as the number of vehicles sold as a result of the campaign, can be reviewed.
![]() (Sent Direct Mail): (Link) The number of prospects who were sent direct mail for the most recent campaign displays as a link. Click this link to access the Campaign Details panel, where information for the corresponding sales campaign, such as the number of vehicles sold as a result of the campaign, can be reviewed.
(Sent Direct Mail): (Link) The number of prospects who were sent direct mail for the most recent campaign displays as a link. Click this link to access the Campaign Details panel, where information for the corresponding sales campaign, such as the number of vehicles sold as a result of the campaign, can be reviewed.
The Expanded view of the Active Campaign performance indicator is used to view information about the number of prospects who have been contacted during the most recent sales campaign, as well as the number of vehicles that have been sold as a result. To access the Expanded view, click the ![]() (Expand) icon.
(Expand) icon.
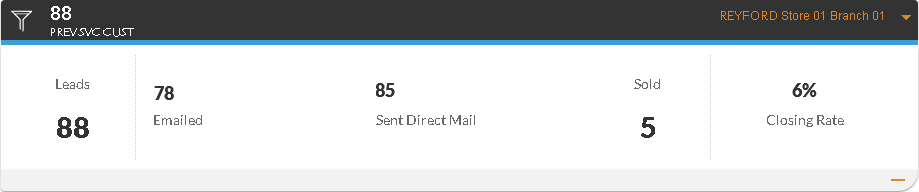
The following items display on the Active Campaign performance indicator in the Expanded view.
Leads: (Link) The total number of prospects who were included in the most recent campaign displays as a link. Click this link to access the Campaign Details panel, where information for the corresponding sales campaign, such as the number of vehicles sold as a result of the campaign, can be reviewed.
Emailed: (Link) The number of prospects who were sent Email messages for the most recent campaign displays as a link. Click this link to access the Campaign Details panel, where information for the corresponding sales campaign, such as the number of vehicles sold as a result of the campaign, can be reviewed.
Sent Direct Mail: (Link) The number of prospects who were sent direct mail for the most recent campaign displays as a link. Click this link to access the Campaign Details panel, where information for the corresponding sales campaign, such as the number of vehicles sold as a result of the campaign, can be reviewed.
Sold: (Link) The number of vehicles sold as a result of the most recent campaign displays as a link. Click this link to access the Campaign Details panel, where information for the corresponding sales campaign, such as the number of vehicles sold as a result of the campaign, can be reviewed.
Closing Rate: (Link) The percentage of customers who purchased vehicles and were contacted for the most recent campaign displays as a link. Click this link to access the Campaign Details panel, where information for the corresponding sales campaign, such as the number of vehicles sold as a result of the campaign, can be reviewed.
The Sold Matches performance indicator is used to review the number of vehicles that were sold as a result of XtreamService leads over various time frames, such as the current month-to-date (MTD). This performance indicator can be viewed in either the Collapsed view or the Expanded view.
The Collapsed view of the Sold Matches performance indicator is used to quickly view the number vehicles that were sold as a result of XtreamService leads during the current month.
Note - The information that displays on this performance indicator varies based on settings defined on the Performance Indicator Settings panel. In addition, the information is automatically updated each night.
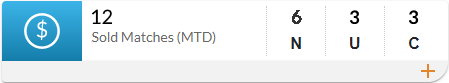
The following items display on the Sold Matches performance indicator in the Collapsed view.
Sold Matches (MTD): (Link) The total number of vehicles sold during the current month as a result of XtreamService leads displays as a link. Click this link to access the Sold Matches window, where information about the corresponding deals, such as the interactions and the types of vehicles sold, can be reviewed.
The following items display on the Sold Matches performance indicator when the New and Used option button is selected on the Performance Indicator Settings panel.
N (New): (Link) The number of new vehicles sold during the current month as a result of XtreamService leads displays as a link. Click this link to access the Sold Matches window, where information about the corresponding deals, such as the interactions and the types of vehicles sold, can be reviewed.
U (Used): (Link) The number of used vehicles sold during the current month as a result of XtreamService leads displays as a link. Click this link to access the Sold Matches window, where information about the corresponding deals, such as the interactions and the types of vehicles sold, can be reviewed.
C (Certified): (Link) The number of certified vehicles sold during the current month as a result of XtreamService leads displays as a link. Click this link to access the Sold Matches window, where information about the corresponding deals, such as the interactions and the types of vehicles sold, can be reviewed.
The following items display on the Sold Matches performance indicator when the Service and Campaign option button is selected on the Performance Indicator Settings panel.
![]() (Service): (Link) The number of vehicles sold during the current month as a result of service interactions associated with XtreamService leads displays as a link. Click this link to access the Sold Matches window, where information about the corresponding deals, such as the interactions and the types of vehicles sold, can be reviewed.
(Service): (Link) The number of vehicles sold during the current month as a result of service interactions associated with XtreamService leads displays as a link. Click this link to access the Sold Matches window, where information about the corresponding deals, such as the interactions and the types of vehicles sold, can be reviewed.
![]() (Campaign): (Link) The number of vehicles sold during the current month as a result of XtreamService leads associated with campaigns displays as a link. Click this link to access the Sold Matches window, where information about the corresponding deals, such as the interactions and the types of vehicles sold, can be reviewed.
(Campaign): (Link) The number of vehicles sold during the current month as a result of XtreamService leads associated with campaigns displays as a link. Click this link to access the Sold Matches window, where information about the corresponding deals, such as the interactions and the types of vehicles sold, can be reviewed.
The Expanded view of the Sold Matches performance indicator is used to view information about sold vehicles over various time frames, including the current MTD and the current year-to-date (YTD). To access the Expanded view, click the ![]() (Expand) icon.
(Expand) icon.
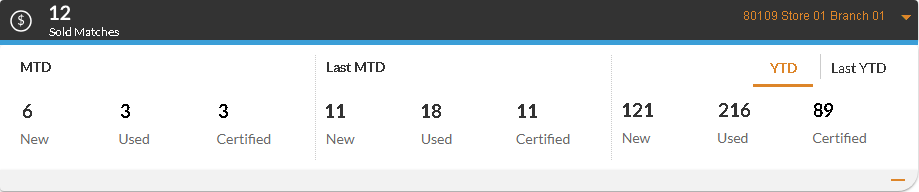
When the Sold Matches performance indicator is expanded, information displays for the current MTD, the last MTD, and the current YTD. To view information for the last YTD, select the Last YTD option.
The current MTD includes data from the first day of the month to the current date, and the previous MTD includes data from the same date range in the previous month. For example, when the performance indicator is reviewed on September 14, 2025, the current MTD includes data for September 1 to September 14, 2025, and the previous MTD includes data for August 1 to
The current YTD includes data from the first day of the year to the current date, and the previous YTD includes data from the same date range in the previous year. For example, when the performance indicator is reviewed on September 14, 2025, the current YTD includes data for January 1 to September 14, 2025, and the previous YTD includes data for January 1 to
Additionally, once this performance indicator is expanded, the Sold Matches Gross performance indicator, which displays gross profit information for sold matches, becomes available.
The following items display on the Sold Matches performance indicator in the Expanded view when the New and Used option button is selected on the Performance Indicator Settings panel.
MTD/Last MTD - New: (Link) The number of new vehicles sold during the current or previous month-to-date (MTD) as a result of XtreamService leads displays as a link. Click this link to access the Sold Matches window, where information about the corresponding deals, such as the interactions and the types of vehicles sold, can be reviewed.
MTD/Last MTD - Used: (Link) The number of used vehicles sold during the current or previous MTD as a result of XtreamService leads displays as a link. Click this link to access the Sold Matches window, where information about the corresponding deals, such as the interactions and the types of vehicles sold, can be reviewed.
MTD/Last MTD - Certified: (Link) The number of certified vehicles sold during the current or previous MTD as a result of XtreamService leads displays as a link. Click this link to access the Sold Matches window, where information about the corresponding deals, such as the interactions and the types of vehicles sold, can be reviewed.
YTD/Last YTD - New: The number of new vehicles sold during the current or previous year-to-date (YTD) as a result of XtreamService leads displays.
YTD/Last YTD - Used: The number of used vehicles sold during the current or previous YTD as a result of XtreamService leads displays.
YTD/Last YTD - Certified: The number of certified vehicles sold during the current or previous YTD as a result of XtreamService leads displays.
The following items display on the Sold Matches performance indicator in the Expanded view when the Service and Campaign option button is selected on Performance Indicator Settings panel.
MTD/Last MTD - Service: (Link) The number of vehicles sold to service customers during the current or previous MTD as a result of XtreamService leads displays as a link. Click this link to access the Sold Matches window, where information about the corresponding deals, such as the interactions and the types of vehicles sold, can be reviewed.
MTD/Last MTD - Campaign: (Link) The number of vehicles sold to clients on campaigns during the current or previous MTD as a result of XtreamService leads displays as a link. Click this link to access the Sold Matches window, where information about the corresponding deals, such as the interactions and the types of vehicles sold, can be reviewed.
YTD/Last YTD - Service: The number of vehicles sold to service customers during the current or previous YTD as a result of XtreamService leads displays.
YTD/Last YTD - Campaign: The number of vehicles sold to clients on campaigns during the current or previous YTD as a result of XtreamService leads displays.
The Trade-Ins performance indicator is used to review the number of vehicles sold that were previously purchased from XtreamService leads. This performance indicator can be viewed in either the Collapsed view or the Expanded view.
The Collapsed view of the Trade-Ins performance indicator can be used to quickly view the number of sold matches during the current month-to-date (MTD).
Note - The information in this performance indicator is updated each night.
The following items display on the Trade-Ins performance indicator in the Collapsed view.
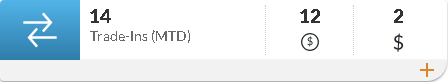
Trade-Ins (MTD): (Link) The number of vehicles sold during the current month that were purchased from XtreamService leads displays as a link. Click this link to access the Trade-Ins window, where information about the corresponding deals, such as the names of the customers and the types of vehicles sold, can be reviewed.
![]() (Sold Matches): (Link) The number of vehicles purchased from XtreamService leads that were sold during the current month to other XtreamService leads displays as a link. Click this link to access the Trade-Ins window, where information about the corresponding deals, such as the names of the customers and the types of vehicles sold, can be reviewed.
(Sold Matches): (Link) The number of vehicles purchased from XtreamService leads that were sold during the current month to other XtreamService leads displays as a link. Click this link to access the Trade-Ins window, where information about the corresponding deals, such as the names of the customers and the types of vehicles sold, can be reviewed.
![]() (Other Sales): (Link) The number of vehicles purchased from XtreamService leads that were sold during the current month to customers not associated with an XtreamService lead displays as a link. Click this link to access the Trade-Ins window, where information about the corresponding deals, such as the names of the customers and the types of vehicles sold, can be reviewed.
(Other Sales): (Link) The number of vehicles purchased from XtreamService leads that were sold during the current month to customers not associated with an XtreamService lead displays as a link. Click this link to access the Trade-Ins window, where information about the corresponding deals, such as the names of the customers and the types of vehicles sold, can be reviewed.
The Expanded view of the Trade-Ins performance indicator can be used to view information about vehicles sold over various time frames. The number of vehicles sold can be viewed based on the current MTD, the previous MTD, the current year-to-date (YTD), and the previous YTD.
This view also displays the median number of turnaround days for each time frame. Turnaround days are the number of days elapsed between the purchase of a trade-in vehicle by the dealership and the sale of that vehicle.
To access the Expanded view, click the ![]() (Expand) icon.
(Expand) icon.
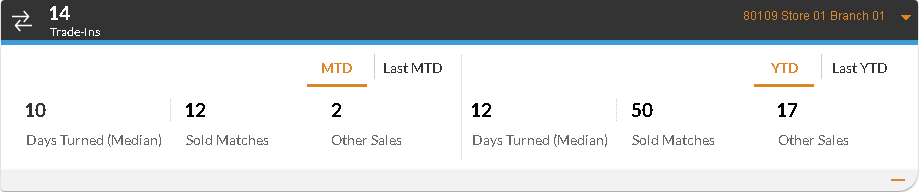
When the Trade-Ins performance indicator is expanded, information displays for the current MTD and the current YTD. To view information for the previous MTD or the last YTD, select the Last MTD option or the Last YTD option, respectively.
The current MTD includes data from the first day of the month to the current date, and the previous MTD includes data from the same date range in the previous month. For example, when the performance indicator is reviewed on September 14, 2025, the current MTD includes data for September 1 to September 14, 2025, and the previous MTD includes data for August 1 to
The current YTD includes data from the first day of the year to the current date, and the previous YTD includes data from the same date range in the previous year. For example, when the performance indicator is reviewed on September 14, 2025, the current YTD includes data for January 1 to September 14, 2025, and the previous YTD includes data for January 1 to
The following items display on the Trade-Ins performance indicator in the Expanded view.
MTD/Last MTD - Days Turned (Median): The median number of turnaround days for vehicles sold during the current or previous month-to-date (MTD) displays. The median number of turnaround days is calculated by ordering the number of turnaround days for all vehicles with the lowest number being first, and then identifying the number in the middle. For example, if one vehicle was sold within three days of being in stock, another within four days, and a third within six days, then four is the median number of turnaround days.
MTD/Last MTD - Sold Matches: (Link) The number of vehicles purchased from XtreamService leads and sold during the current or previous MTD to other XtreamService leads displays as a link. Click this link to access the Trade-Ins window, where information about the corresponding deals, such as the names of the customers and the types of vehicles sold, can be reviewed.
MTD/Last MTD - Other Sales: (Link) The number of vehicles purchased from XtreamService leads and sold during the current or previous MTD to customers not associated with XtreamService leads displays as a link. Click this link to access the Trade-Ins window, where information about the corresponding deals, such as the names of the customers and the types of vehicles sold, can be reviewed.
YTD/Last YTD - Days Turned (Median): The median number of turnaround days for vehicles sold during the current or previous year-to-date (YTD) displays.
YTD/Last YTD - Sold Matches: The number of vehicles purchased from XtreamService leads and sold during the current or previous YTD to other XtreamService leads displays.
YTD/Last YTD - Other Sales: The number of vehicles purchased from XtreamService leads and sold during the current or previous YTD to customers not associated with XtreamService leads displays.
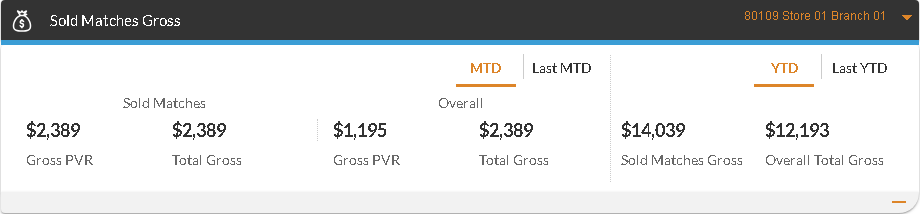
The Sold Matches Gross performance indicator is used to review the gross profit information for sold matches over various time frames. Sold matches are vehicles that were sold as a result of XtreamService leads. This performance indicator can also be used to compare profits from sold matches to the overall gross profits for all vehicles sold.
Note - The Sold Matches Gross performance indicator is available only if the user has been granted access to view gross profits on the User Management screen.
The Sold Matches Gross performance indicator displays information for the current month-to-date (MTD) and the current year-to-date (YTD). To view information for the last MTD or the last YTD, select the Last MTD option or the Last YTD option, respectively.
The current MTD includes data from the first day of the month to the current date, and the previous MTD includes data from the same date range in the previous month. For example, when the performance indicator is reviewed on September 14, 2025, the current MTD includes data for September 1 to September 14, 2025, and the previous MTD includes data for August 1 to
The current YTD includes data from the first day of the year to the current date, and the previous YTD includes data from the same date range in the previous year. For example, when the performance indicator is reviewed on September 14, 2025, the current YTD includes data for January 1 to September 14, 2025, and the previous YTD includes data for January 1 to
The following items display on the Sold Matches Gross performance indicator.
MTD/Last MTD - Sold Matches Gross PVR: (Link) The gross profit amount per vehicle sold as a result of an XtreamService lead during the current or previous month-to-date (MTD) displays as a link. Click this link to access the Sold Matches window, where information about the corresponding deals, such as the interactions and the types of vehicles sold, can be reviewed.
MTD/Last MTD - Sold Matches Total Gross: (Link) The total gross profit amount for vehicles sold as a result of XtreamService leads during the current or previous MTD displays as a link. Click this link to access the Sold Matches window, where information about the corresponding deals, such as the interactions and the types of vehicles sold, can be reviewed.
MTD/Last MTD - Overall Gross PVR: The gross profit amount per vehicle displays for all vehicles sold during the current or previous MTD.
MTD/Last MTD - Overall Total Gross: The total gross profit amount displays for all vehicles sold during the current or previous MTD.
YTD/Last YTD - Sold Matches Gross: The total gross profit amount displays for vehicles sold to XtreamService leads during the current or previous year-to-date (YTD).
YTD/Last YTD - Overall Total Gross: The total gross profit amount displays for all vehicles sold during the current or previous YTD.
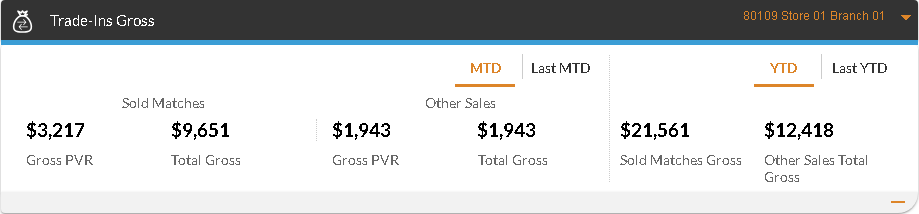
The Trade-Ins Gross performance indicator is used to review the gross profit information for vehicles acquired from XtreamService leads that have recently been sold. This performance indicator can also be used to compare profits from vehicles purchased from XtreamService leads that were then sold to other XtreamService leads to the gross profits from those vehicles being sold to customers not associated with XtreamService leads.
Note - The Trade-Ins Gross performance indicator is available only if the user has been granted access to view gross profits on the User Management screen.
The Trade-Ins Gross performance indicator displays information for the current month-to-date (MTD) and the current year-to-date (YTD). To view information for the last MTD or the last YTD, select the Last MTD option or the Last YTD option, respectively.
The current MTD includes data from the first day of the month to the current date, and the previous MTD includes data from the same date range in the previous month. For example, when the performance indicator is reviewed on September 14, 2025, the current MTD includes data for September 1 to September 14, 2025, and the previous MTD includes data for August 1 to
The current YTD includes data from the first day of the year to the current date, and the previous YTD includes data from the same date range in the previous year. For example, when the performance indicator is reviewed on September 14, 2025, the current YTD includes data for January 1 to September 14, 2025, and the previous YTD includes data for January 1 to
The following items display on the Trade-Ins Gross performance indicator.
MTD/Last MTD - Sold Matches Gross PVR: (Link) The gross profit amount per vehicle sold displays as a link. Only vehicles purchased from XtreamService leads that were sold to customers associated with XtreamService leads during the current or previous month-to-date (MTD) are included in this gross profit amount. Click this link to access the Trade-Ins window, where information about the corresponding deals, such as the names of the customers and the types of vehicles sold, can be reviewed.
MTD/Last MTD - Sold Matches Total Gross: (Link) The total gross profit amount for vehicle sales displays as a link. Only vehicles purchased from XtreamService leads that were sold to customers associated with XtreamService leads during the current or previous MTD are included in this total. Click this link to access the Trade-Ins window, where information about the corresponding deals, such as the names of the customers and the types of vehicles sold, can be reviewed.
MTD/Last MTD - Other Sales Gross PVR: (Link) The gross profit amount per vehicle sold displays as a link. Only vehicles purchased from XtreamService leads that were to sold to customers not associated with XtreamService leads during the current or previous MTD are included in this gross profit amount. Click this link to access the Trade-Ins window, where information about the corresponding deals, such as the names of the customers and the types of vehicles sold, can be reviewed.
MTD/Last MTD - Other Sales Total Gross: (Link) The total gross profit amount for vehicle sales displays as a link. Only vehicles purchased from XtreamService leads that were sold to customers not associated with XtreamService leads during the current or previous MTD are included in this total. Click this link to access the Trade-Ins window, where information about the corresponding deals, such as the names of the customers and the types of vehicles sold, can be reviewed.
YTD/Last YTD - Sold Matches Gross: The total gross profit amount displays for vehicles purchased from XtreamService leads that were sold to customers associated with XtreamService leads during the current or previous year-to-date (YTD).
YTD/Last YTD - Other Sales Total Gross: The total gross profit amount for vehicles purchased from XtreamService leads that were sold to customers not associated with XtreamService leads during the current or previous YTD.
Click here for a list of products that may be mentioned in this help file.